Information need versus overload
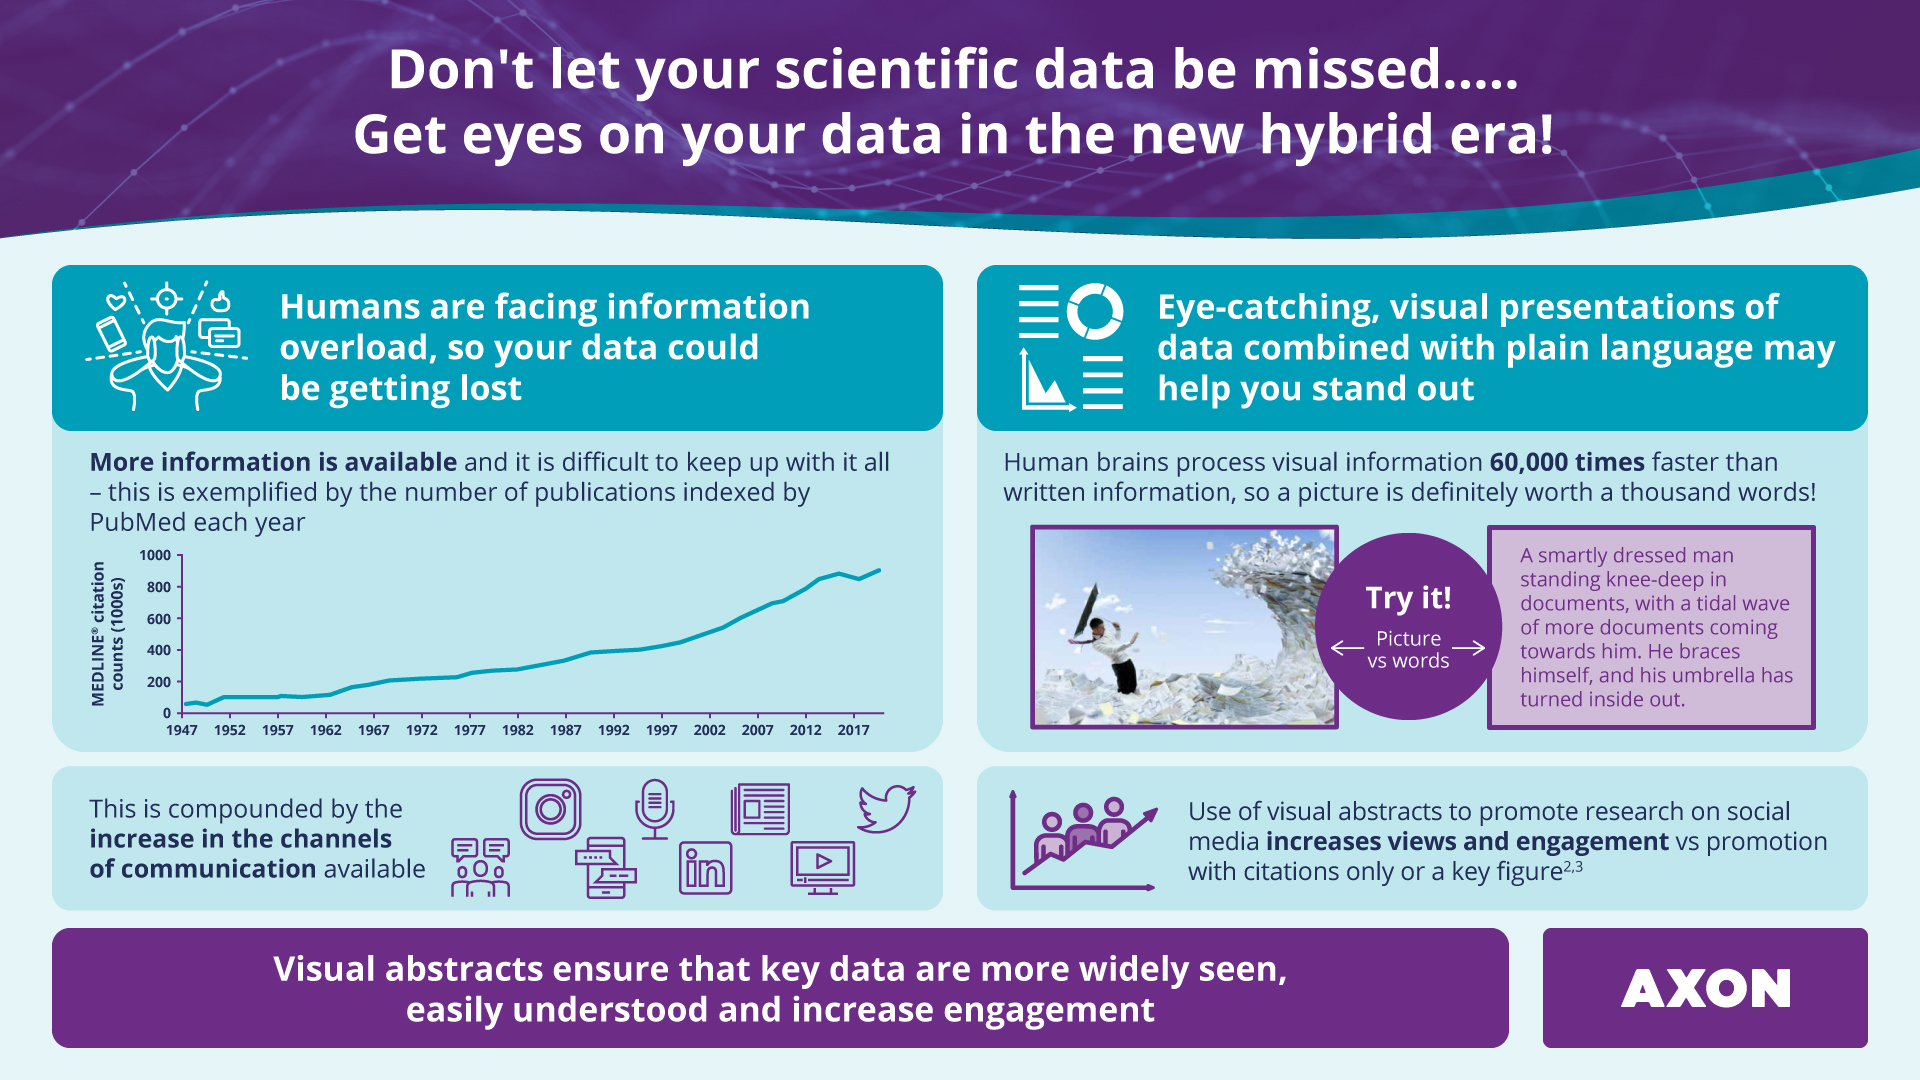
In the virtual era and the evolving hybrid landscape, more channels of communication are generating ever-increasing amounts of content, with the risk that important scientific data are getting lost in this deluge. The need for information has not changed; however, the sheer amount being generated has. This means that many people, including healthcare professionals (HCPs), do not always have time to review and absorb critical data that can impact patient care. Clinicians have an obligation to continue their education to stay at the forefront of their field, so they are information-hungry, yet often time-poor, due to the demands of patient care.
Also, the way in which HCPs look for information has changed. HCPs are increasingly turning to digital content and sources of education1 – particularly since the onset of the pandemic. As physicians have increased their digital engagement in everyday life, they have also changed the way they consume medical information, embracing the accessibility of digital channels and on-demand content.1
Research conducted by McKinsey & Company found that globally, physicians spend at least 1.5 hours online per day researching – with at least half of their research being conducted through social media channels. This means we need to find ways to make data stand out and be easily digestible in the rapidly evolving hybrid healthcare communication sphere. Use of insights can also ensure that the information is presented in the right way through the right channel to meet the information needs of physicians.
Picture power
A picture is worth a thousand words, or so the saying goes. Ancient cultures used pictographs or petroglyphs to tell a story, and through these earliest known examples of writing, we have information about their way of life.
The power of a picture goes further by enabling us to absorb information quickly. To put this in context, human brains reportedly process visual information 60,000 times faster than written information. We are naturally attracted to eye-catching designs and can decipher meaning easily through visual cues, intelligent layouts and clear messaging.
So how do we currently apply this knowledge in science?
The use of graphs, charts and infographics can help people process information quickly. Complex data readouts help organise the results in a meaningful way. Information that is represented visually can help people understand disease mechanisms or help physicians learn about new therapies. Clinical data can benefit from formats that make it easier to grasp and suitable for various communication channels. Graphical abstracts are something we are starting to see more frequently.
Optional caption test
Why consider graphical abstracts?
As highlighted, physicians have an increasing need for education and high-quality information, given the proliferation of speciality and more complex medicine – but they also have more external demands on time and patient care. Visual abstracts can help communicate scientific data quickly and cut through the avalanche of scientific data that inundates us, standing out with clarity and immediacy. Graphical abstracts can extend the reach of scientific data, because they can be easily optimised for online use and social media, allowing the data to be easily understood, shared, and engaged with.
In summary, data are getting lost in a sea of information, so eye-catching, visual presentations of data combined with plain language can help the relevant information stand out. Together with our clients and partners, AXON has developed numerous video and visual abstracts and graphical elements to communicate data. We continually assess the need for educational content and how we deliver this in a way that HCPs and people with disease experience prefer, then measure how well it resonates. This way we can continually evolve creative ways data can be presented, in an ever-increasing information-heavy world.
References
- Evers M et al. Medical affairs: Key imperatives for engaging and educating physicians in a digital world. Available here. Last accessed: November 2021.
- Oska S et al. J Med Internet Res. 2020 Dec 4;22(12):e22327. doi: 10.2196/22327.
- Chapman SJ et al. Br J Surg. 2019 Oct 2;1611-1616. doi: 10.1002/bjs.11307. Online ahead of print.